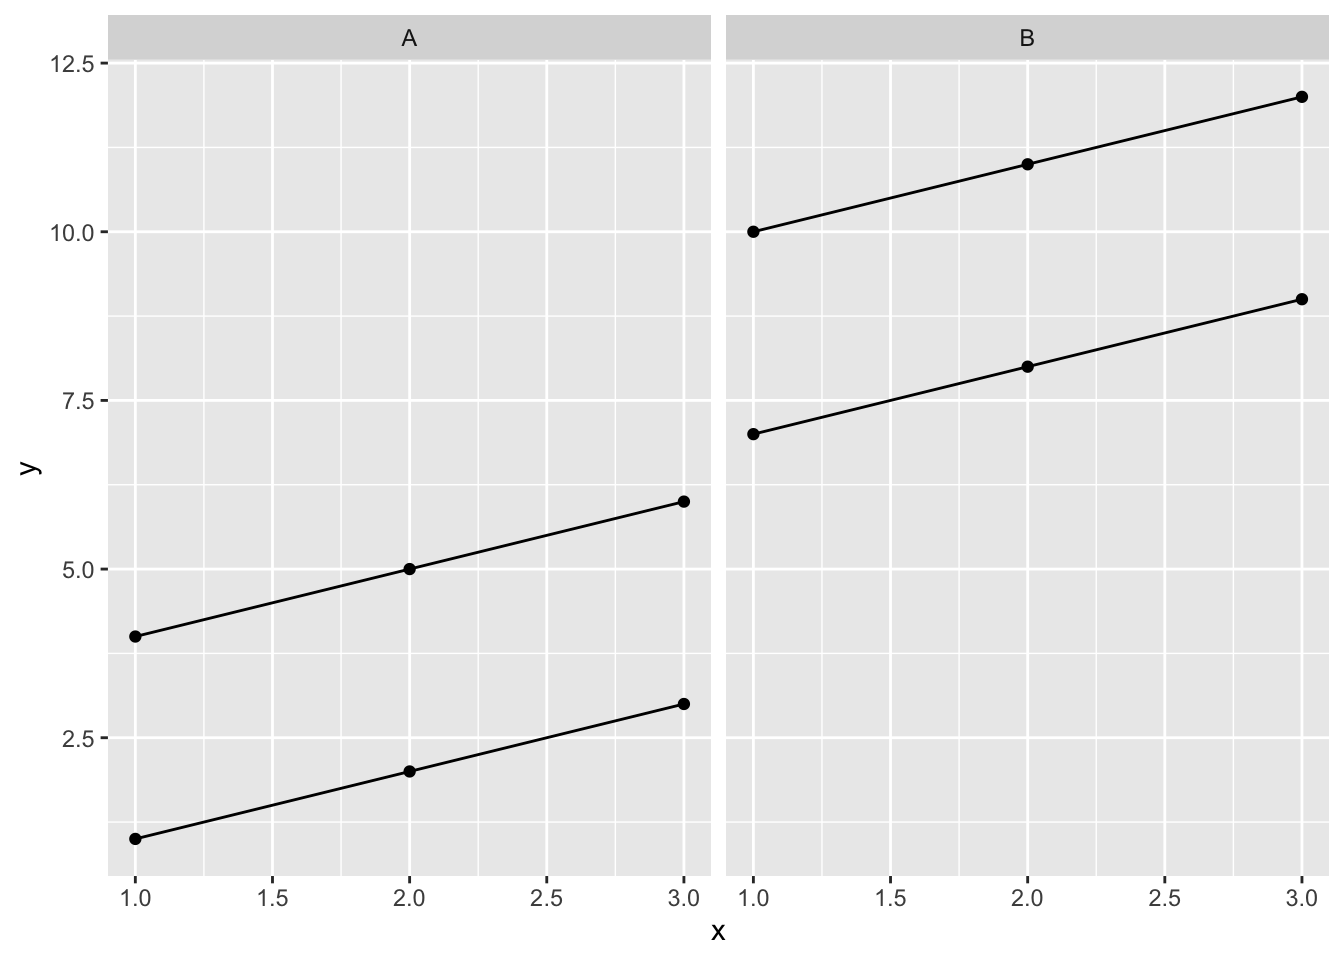
To do so, set scales = "gree_y" in facet_wrap(), so that the scale of y-axis will not be fixed.
Working example:
dat <- data.frame(x = rep(1:3, 4),
y = c(1:12),
individual = factor(c(1,1,1, 2,2,2, 3,3,3, 4,4,4)),
type = factor(c(rep("A", 6), rep("B", 6)))
)
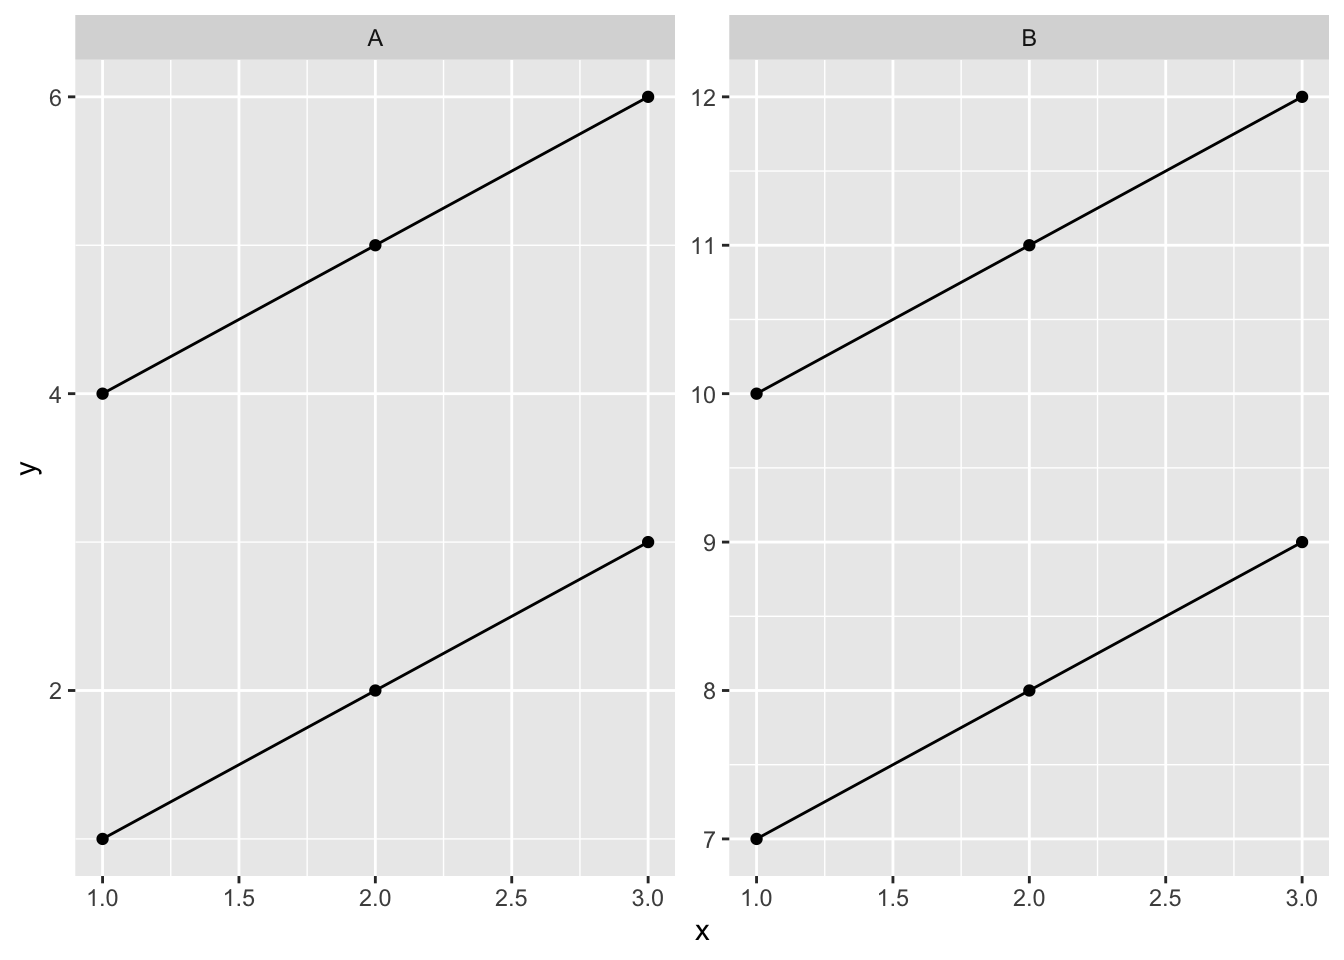
# Fixed scale
dat %>% ggplot(aes(x = x, y = y, group = individual)) +
geom_point() + facet_wrap(type ~ .) +
geom_line()
From the example above we see that the y-axis scale is fixed and identical for both subplots. To free it up:
# Free y-axis
 dat %>% ggplot(aes(x = x, y = y, group = individual)) +
        geom_point() + facet_wrap(type ~ ., scales = "free_y") +
        geom_line()