I often encounter the need of creating figures with subplots, where manually assign titles can become a time-consuming task. In R base plotting, I can quickly assign titles (plus other asthestics) by using the mapply() function:
mapply(function, target, parameters)
Here I use the iris dataset as an example:
##   Sepal.Length Sepal.Width Petal.Length Petal.Width Species
## 1          5.1         3.5          1.4         0.2  setosa
## 2          4.9         3.0          1.4         0.2  setosa
## 3          4.7         3.2          1.3         0.2  setosa
## 4          4.6         3.1          1.5         0.2  setosa
## 5          5.0         3.6          1.4         0.2  setosa
## 6          5.4         3.9          1.7         0.4  setosa
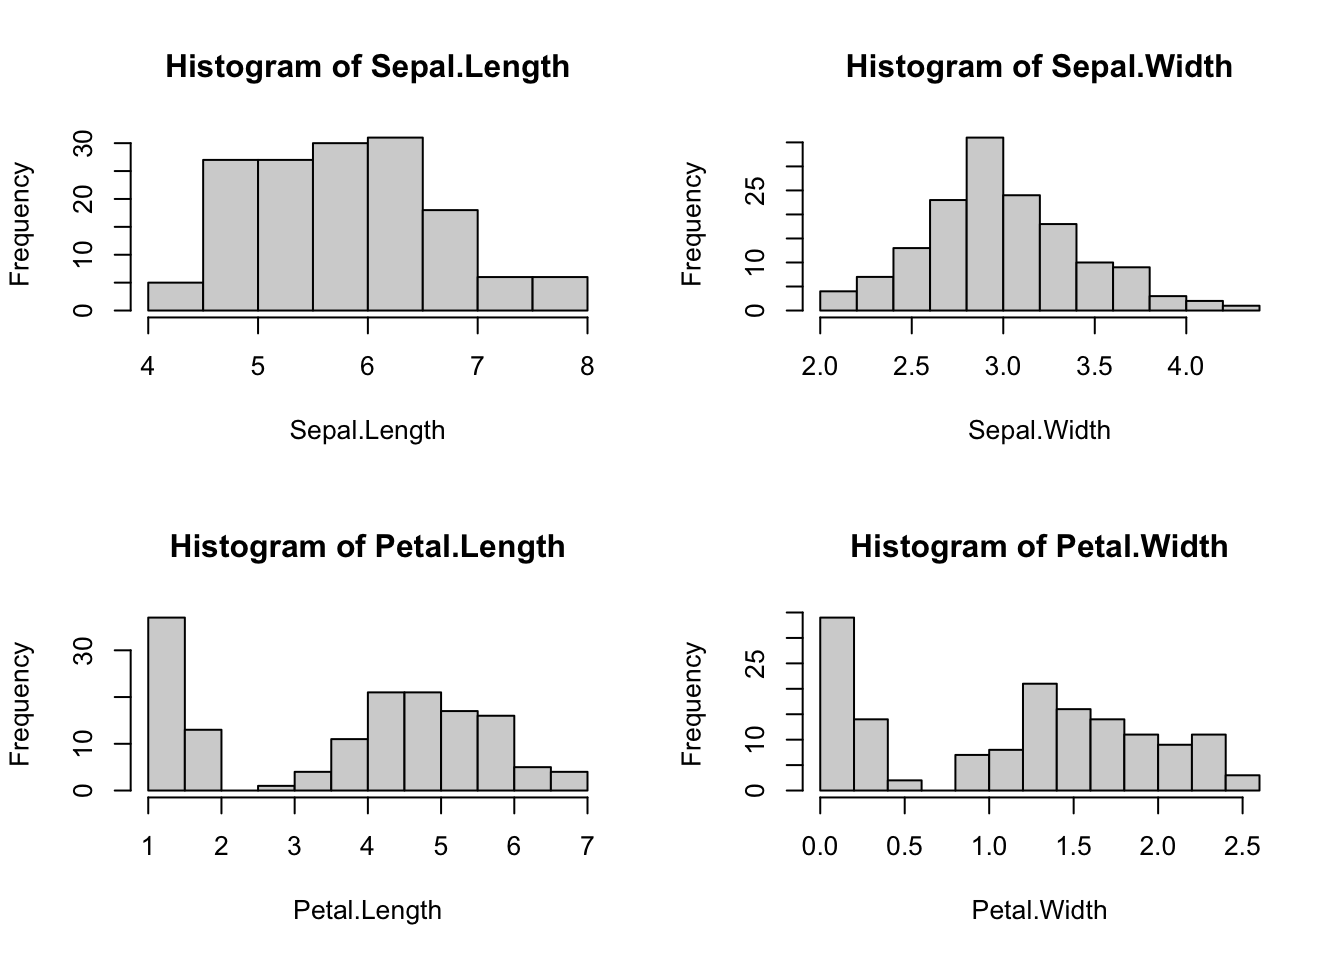
I’d like to plot out histograms to look at the distributions, and at this stage, I don’t care much about the last column (Species).
# Initialize the plot with 2 rows and 2 columns for subplotting
par(mfrow=c(2,2))

# Plot out histograms for the first 4 columns of iris
mapply(hist, iris[,1:4],
       # Get the column names and assign as x label
       xlab=colnames(iris[,1:4]),
       # Assign "Histogram of ..." as title name (main)
       main=paste0("Histogram of ", colnames(iris[,1:4])))
##          Sepal.Length       Sepal.Width        Petal.Length
## breaks   Numeric,9          Numeric,13         Numeric,13
## counts   Integer,8          Integer,12         Integer,12
## density  Numeric,8          Numeric,12         Numeric,12
## mids     Numeric,8          Numeric,12         Numeric,12
## xname    "dots[[1L]][[1L]]" "dots[[1L]][[2L]]" "dots[[1L]][[3L]]"
## equidist TRUE               TRUE               TRUE
##          Petal.Width
## breaks   Numeric,14
## counts   Integer,13
## density  Numeric,13
## mids     Numeric,13
## xname    "dots[[1L]][[4L]]"
## equidist TRUE
One mapply(), save me tons.