To do so, use the geom_text() function in ggplot expression.
- Specify the
labelattribute in the statement of aesthetic mapping - If needed, justify the positioning of the mapped texts by the
hjustandvjustattributes.
Working example:
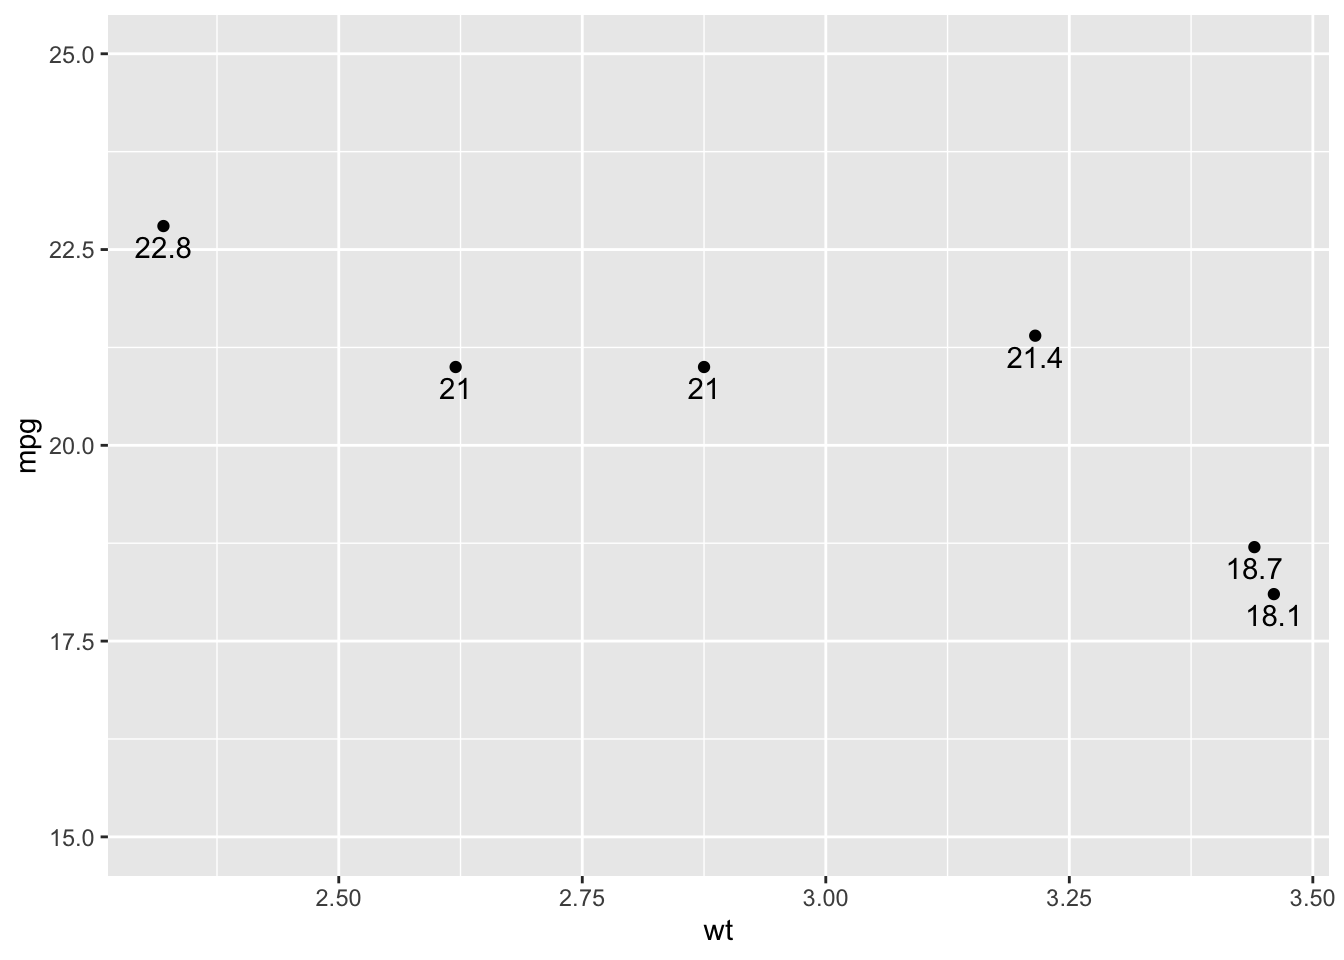
mtcars[1:6, ] %>% ggplot(aes(x = wt, y = mpg)) + geom_point() +
        # Add mpg values onto the plot, and justify the position vertically
        geom_text(aes(label = mpg), vjust = 1.5) +
        ylim(c(15, 25))
See also: Tidyverse documentation